The Bank for International Settlements has just published its preliminary data for financial transactions in 23 countries for 2010. The countries are the same as in 2009 - Australia, Belgium, Brazil, Canada, China, France, Germany, Hong Kong, India, Italy, Korea, Mexico, Netherland, Russia, Saudi Arabia, Singapore, South Africa, Sweden, Switzerland, Turkey, the United Kingdom and the United States. You can download the full report as a pdf file, comparative data as an Excel file, or the specific details country by country as an Excel file. It's a real shame that they don't provide numbers for at least all the Eurozone countries. It's not surprising that the EU can only guess that the Financial Transaction Tax that they propose will generate around 57 billion euros. They based their numbers on - wait for it - the BIS data and the data from the FESE that I mentioned a couple of days ago.
When the European Union doesn't have complete figures for all the countries in the Eurozone, can it be any wonder that nobody can come up with sensible numbers. And to think that Osborne is trying to prevent EU level requirements on reporting.
Anyway, I've extracted what I consider to be the most critical information from the UK data in the full report.
First, here's Table 8 -" Indicators of the use of payment instruments and terminals by non-banks". It shows that last year in the UK, there were over £65 trillion in credit transfers, £948 billion in Direct Debits, £455 billion in Credit Card Payments, and £1,095 billion of Cheque payments. This makes a total of £67.5 trillion of "non-bank" transactions. This is certainly down a lot from the peak of £107.4 trillion in 2007, but it's still a hell of a lot of money. A 1% charge on that would generate enough revenue to abolish all the other forms of taxes in the UK - Income tax, VAT, Corporation tax, Stamp Duty etc which only raise about £538 billion. These transactions are not likely to move anywhere else.
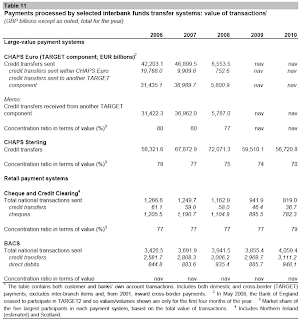
Table 11, which reports "Payments processed by selected interbank funds transfer systems", tells us that the CHAPS system handled £56.7 trillion of credit transfers, and that the BACS system handled a further £4 trillion.
Table 18, which should provide numbers for the Values of executed trades for the London Stock Exchange and the Virt-x system just says "nav" (Not available) for every year since 2006. Funny that, the City doesn't seem to be providing the numbers? How can that be?
In Table 21 ("Values of contracts and transactions cleared") informs us that LCH.Clearnet Ltd hasn't provided the number for sterling contracts (it was £588.8 trillion in 2009), but we do learn that contracts and transactions in Euros went up to €19.5 trillion in 2010 from €12.6 trillion in 2009. If the Sterling exchanges have gone up by a similar amount, LCH.Clearnet might well have handled something close to £1000 trillion.
Finally, Table 26 ("Value of delivery instructions processed"), tells us that the CREST system handled £143.5 trillion, somewhat down on 2009, but substantially higher than for 2006-8.
By adding up the different numbers, I would estimate that financial transactions in the UK that are reported to the BIS are likely to be at least as large as in 2009, when they totalled £911 trillion, and could easily top £1000 trillion. Applying the 0.1% FTT proposed by the European Union, and immediately rejected by the UK government could raise as much as £1 trillion - enough to pay off roughly half of the UK's national debt in a single year.
The truly mind-boggling fact is that these numbers don't include anything for the London Stock Exchange. They don't include the £300 trillion a year in Foreign Exchange going through the City of London, and the £190 trillion of OTC Derivatives trading. And who has the foggiest clue about how much trading in more obscure financial instruments such as Credit Default Swaps (CDSs), Collateralized Debt Obligations (CDOs), Exchange Traded Funds (ETFs) etc etc etc. There is apparently no requirement to report these values.
A couple of days ago, I added up the numbers for trading on the FESE website for 2003-2011. What I failed to notice at the time is that two major Exchanges that are supposed to be included in the dataset didn't provide the numbers for 2010 and 2011. One was Italiana Borsa. And the other one? Yep - you guessed right: it was our friends at the London Stock Exchange yet again.
Conclusions? 1) The UK appears to be the world leader in Under-The-Counter Trading, and 2) the UK public has to realise that there really is a Plan B. It simply requires that the UK government aligns with the rest of Europe and imposes a modest tax on financial transactions.


No comments:
Post a Comment